|
| natural radiation map April 3rd |
Thank goodness the leakage of high radiation water at last stopped. On high or low, I’ve learned that radiation rates depend on variables, but that leak from the pit near the Reactor two was way too high.
At Fukushima Daiichi, operators have been dumping their accumulated low radiation water into the ocean since yesterday. They call it low because apparently France and Britain have been dumping their processed radiation water of similar rate. I didn’t know that. Nobody has given us the comparison data. I read it in Nikkei newspaper yesterday. It was not on the first page. I’d like to know the rate from each country such as Japan and the U.S. We all must be dumping the processed water tainted with radiation.
By reading the New York Times, I haven’t seen much explanation about high or low on radiation. Their articles tend to report on high, higher, and highest on radiation in Fukushima. An article on the NY Times on April 1st still stresses on expanding the danger zone to 80 km radius. The article focuses on one higher radiation spot. I wondered if the article was a reprint for a moment.
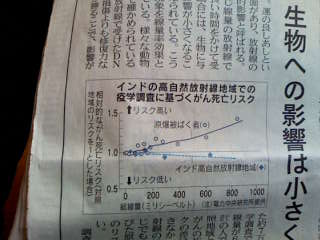
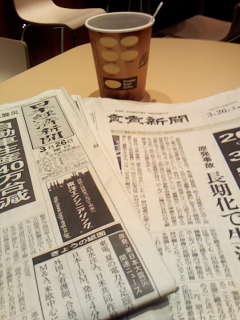
Daily, Japanese newspapers report on radiation rates by region. They are low. See the photos. Again, Japanese announcers do not compare much with foreign countries. They would say, “It has gone up slightly,” or “it went down to normal rate.” The rates of natural radiation in Japan are very small compared with the rates in foreign countries. I watched one Japanese program in which a Japanese expert showed the average radiation of the world as 0.5. I think the unit is micro sievert. That’s ten times higher than the Japan’s average. I couldn’t believe it. In another television program, I saw the average of the U.S. natural radiation was 0.4. In Yokohama, it’s about 0.04. 0.04 is the Japan’s average.
Right now, Tokyo’s average is double the Yokohama rate, but no need to be alarmed when we compare it with the world average. That’s why people say, “it’s high or higher than normal, but it won’t affect on our health, it’s minimal.” According to the numbers on the photo, that’s true. Government officials and announcers are telling own citizens, not to the citizens of other country.
About the food contaminated with radiation, one Japanese expert said that if we ate, although we will never do that on purpose, such spinach and drink such water and milk for one year, the amount of radiation we take in will be similar amount as we might receive if we simply live in a foreign country with the average radiation. You can imagine why they say that. But I assure you that the opinion was directed to calm the Japanese public. The expert did not speak in an arrogant way, and no one would like to compare with foreign countries and say we are better in any way, especially at the time of spilling HIGH radiation water into the ocean.
I can see why Japanese government officials don’t talk much comparing with foreign countries although they are doing it now in a very slow and delicate way. They don’t want to create more harm than they already have. They don’t want to boast the good thing Japan has enjoyed all these years in face of this gigantic nuclear radiation problem.
I don’t know the reason why the natural radiation Japan receives is so low compared to the average in the world. I guess it is just the way it is. It is interesting though that China is very close to Japan, but their average is 0.54.
Further, even in Japan, our natural radiation rates vary by region. I heard that Kansai area is double the Kanto area. Osaka and Kyoto are in Kansai. Tokyo and Yokohama are in Kanto. Separately, also Ibaragi is in Kanto, not the northeast. One of the reports I read in Huffington, Ibaragi was the part of the northeast.
But how the radioactive materials are spreading if they are? I don’t understand their spread with the relationship to the natural radiation map with numbers. Asahi newspaper listed the following site but it said it isn’t detail. It also said the machine broke after giving an output once. www.jma.go.jp/jma/kokusai/kokusai_eer.html IAEA also is collecting data for making global forecasts. I wonder if the system was used before and how accurate it has been. I see many sites, but I just need one easy map to see and the info. to be correct. That is my concern.
About the design of Fukushima Daiichi Nuclear reactors, it was confirmed that it was old. No surprise there. Toshiba and Hitachi tried to imitate GE’s design to learn how to build reactors. The emergency generators that failed should have been housed in more secure place. The CEO of GE made his visit to Japan after three weeks from the accident. I haven’t heard much about whose responsibility the design is, but I sense a little bit what’s going on. The language barrier must be great. That’s my hunch. I think imitating is a good way to learn as junior engineers, but to build nuclear reactors, imitating alone is enough. We have to know what we are doing from core and include all the error routines and seek expert opinions in each category and synchronize all the knowledge. I saw a photo of spaghetti wiring plus tube looking things overhead that a former nuclear reactor engineer has shown. I used to watch customer engineers work under the floor of mainframe computers, but it is much worse. It looked like a giant mess.